ESOLarge, white ESO logo.
  • EMS
    • EMS
    • EHR
    • Analytics
    • Scheduling
    • Activities
    • Asset Management
    • Checklists
    • Inventory
    • HDE
    • Alerting
    • Personnel Management
    • On-Demand Learning
    • NarcBox
    • EMS1 Academy
  • Fire
    • Fire
    • Incidents
    • Properties & Inspections
    • Permits
    • Scheduling
    • Activities
    • Asset Management
    • Hydrants
    • Checklists
    • EHR
    • Analytics
    • Personnel Management
    • On-Demand Learning
    • NarcBox
    • FireRescue1 Academy
  • Hospital
    • Hospital
    • Health Data Exchange
    • Patient Registry
    • Analytics
    • Alerting
  • Government
  • Research
  • Resources
    • COVID-19
    • Resource Library
    • Blog
    • Support
  • About
    • About
    • Careers
    • Events
    • WAVE 2022
    • News
  • Support
    • Support
    • CDM by ESO
    • DI by ESO
    • Lancet by ESO
  • Log In
  • Request a Demo
  • Search
  • Menu Menu

COVID-19 Resource Center.

2020 ESO EMS Index: COVID-19 Special Edition

ESO Data Dashboard Product Updates Customer Resources Operations FAQ
Mortality Rate and Acuity of Hospitalized COVID-19 EMS Patients EMS COVID-19 and Influenza-like Illness Surveillance 911 Call Volume and Personal Protective Equipment (PPE) Limitations

Mortality Rate and Acuity of Hospitalized COVID-19 EMS Patients
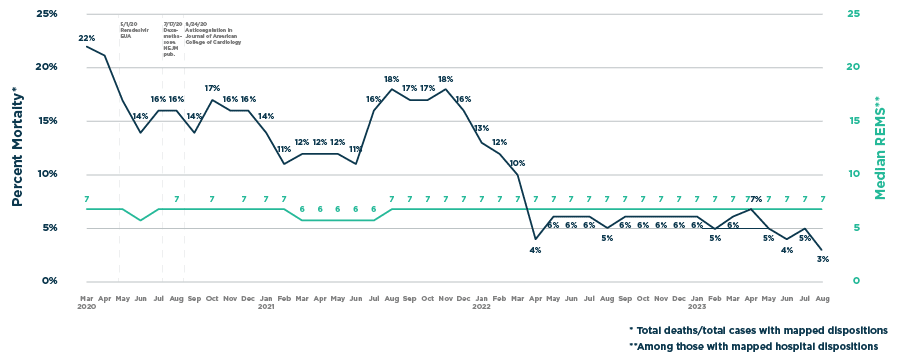
covid-19 bar graph

This is an extremely important graph with two key messages:

1) The percentage of EMS COVID-19 patients who died in the hospital has decreased substantially, from between 21-22% in April to between 14-16% now.

2) The acuity of EMS patients admitted to the hospital has not changed. The Rapid Emergency Medicine Score (REMS) is a validated tool that predicts mortality and – based on recent ESO research – need for hospital admission. The median REMS for EMS COVID-19 patients admitted to the hospital has remained steady throughout the pandemic between 6-7 (out of a possible 26). Previous reports indicate that approximately 45% of EMS patients with this REMS score will require hospital admission, and 8% are likely to die, confirming that while we are seeing improvement in outcomes, COVID patients are suffering more death than would be anticipated by their severity score.

What is the take-home message? From an EMS perspective, we should continue to expect the acuity of our COVID-19 patients to remain about the same. However, it appears hospital treatment (you can see some important milestones on the graph) has improved as more data has been available and shared regarding optimal therapies, resulting in a reduction in hospital mortality. It’s important to note this mortality remains above that of other conditions that often warrant hospital admission.

EMS COVID-19 and Influenza-like Illness Surveillance

911 Records with COVID-19 EMS Provider Impressions

EMS responses with a clinical impression of COVID-19 are on the rise. The peaks in April and mid-summer reflect the first two waves of COVID-19 in the US. Upticks for the waves in EMS tend to lead hospital data by about a week.

911 Records with COVID-19 ED or Hospital Diagnoses

The previous graph includes patients that were identified as COVID-19 by EMS providers. This graph reflects patients transported by EMS who were positively diagnosed with COVID-19 in the ED or hospital (regardless of the EMS primary impression). This graph reflects the three waves of the pandemic and illustrates the importance of linking EMS records to hospital outcomes.

COVID-19 Deaths: EMS 911 Transports

This graph looks at the daily moving average for patients who were transported by EMS and died in the hospital with a COVID-19 diagnosis. The curve follows the three waves of the pandemic but does not appear to be increasing as dramatically in October/November as one would expect based upon the high number of cases and transports. Because there are delays in the recording of hospital deaths, this graph ends several weeks before the other graphs on this page.

It is important to note the difference between this graph and the COVID-19 outcomes graph. This graph reflects the total number of deaths, which is rising. The outcomes graph shows a reduction in the PERCENTAGE of EMS COVID-19 patients who die, which is going down because the number of patients is rising faster than the number of deaths, presumably due to improved therapeutics for hospitalized patients and differences in patient characteristics.

911 Records with Influenza-like Illness (ILI) EMS Provider Impressions

911 Call Volume and Personal Protective Equipment (PPE)

Documented PPE Use among All 911 Records


Documented Use and Reuse of N95 Respirators among All 911 Records

Limitations

*This page will be updated daily Monday through Friday. Data are published with a 48-hour delay to allow adequate time for providers to complete and lock records.

The following reports include records with an EMS provider primary or secondary impression of:

COVID-19 – Confirmed by testing
COVID-19 – Exposure to confirmed patient
COVID-19 – Suspected – no known exposure

Because these reports are based on EMS provider impression and information available in the out-of-hospital setting, these records may or may not represent confirmed COVID-19 cases.

Scroll to top

Subscribe to Emails

Receive research, event invitations, and more to your inbox
Thank you for subscribing.
ESO white footer logo.
© 2022 eso All rights reserved.

Navigation

  • Home
  • EMS
  • Fire
  • Hospital
  • State
  • Research
  • Resources
  • About ESO
  • Support
  • Log In

Contact Us

  • 11500 Alterra Parkway
    Suite 100 Austin, TX 78758
  • 512-593-6376
  • Call or Email Us

Legal

  • Legal Terms
  • Privacy Policy
  • Website Terms and Conditions of Use

Get In Touch

X